
Infographic
Q4 and 2025 trade-in and upgrade trends: A record-breaking year
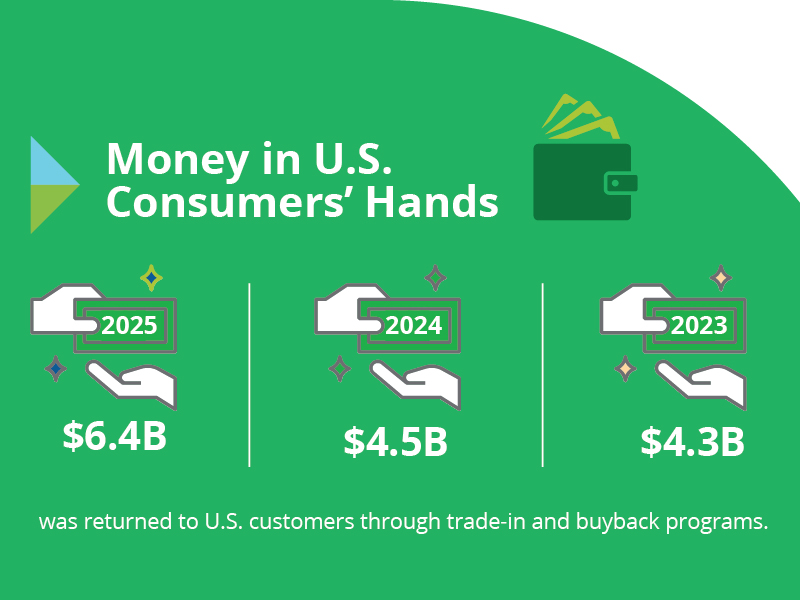
In 2025, mobile trade-in programs returned a record $6.4 billion to consumers — a 42% increase over 2024. This growth reflects the continued strength of trade‑in programs and the rising presence of 5G devices in the secondary market. Our latest data shows a year shaped by longer device ownership and ongoing consumer demand to capture value from their smartphones.
Quick summary: key 2025 statistics
For a snapshot of the year’s biggest trends, here are the numbers that defined the secondary device market in 2025.
- Total value returned: $6.4 billion (up 42% year-over-year)
- Q4 value: $2.2 billion (highest single quarter on record)
- Top traded device: iPhone 13 (for the fourth straight quarter)
- Top Android device: Samsung Galaxy S22 Ultra 5G (for the sixth straight quarter)
- Average iPhone age: 3.80 years
- Average Android age: 3.96 years
Which phones are people trading in the most?
The iPhone 13 remained the most frequently turned-in device from trade-in and upgrade programs in every quarter of 2025. It also marks the first year when every device in the top five was 5G-enabled. This shift strengthens the value of the secondary market and supports higher trade-in payouts for consumers.
On the Android side, the Samsung Galaxy S22 Ultra 5G held its position as the top traded Android device, as it has for the last six quarters.
How long are people keeping their phones?
One of the clearest trends from 2025 is that consumers are holding on to their phones longer before upgrading. The average age of devices at turn-in reached new highs.
- iPhones: 3.80 years (up from 3.67 years in 2024)
- Android devices: 3.96 years (up from 3.52 years in 2024)
The fourth quarter marked a significant milestone for Android devices specifically. For the first time across any smartphone category, the average age of Android devices at turn-in surpassed four years, hitting 4.1 years. This signals that devices are more durable than ever, ownership cycles are lengthening, and consumers expect a payout when they finally choose to upgrade.
What do these trends mean for you?
These trends point to a trade-in and upgrade ecosystem that delivers more value and supports a healthier circular economy for all stakeholders. By extending the life of devices and rewarding consumers at historic levels, these programs benefit all participants in the ecosystem. As we move through 2026, trade-in programs remain a critical way for consumers to upgrade affordably while supporting sustainability.
Explore the full Q4 and 2025 Trade-in and Upgrade Infographics to see how these trends are shaping the future of device upgrades.

Assurant Editorial Team
The Assurant Editorial Team shares stories that inspire and empower, helping you unlock opportunities and stay ahead with the latest research and insights. Assurant is a premier global protection company that partners with the world's leading brands. As a Fortune 500 company operating in 21 countries, we leverage data-driven technology solutions to provide exceptional customer experiences.