Infographic
Q1 2026 smartphone trade in and upgrade trends: Value rises as upgrade cycles stabilize
The smartphone trade‑in market started 2026 with strong momentum. In Q1, consumers captured more value from their devices, trade‑in volumes increased, and newer‑generation smartphones continued to dominate the secondary market. Together, these trends signal a healthy upgrade ecosystem supported by longer device ownership and broader trade‑in eligibility.
Q1 2026 trade‑in and upgrade highlights
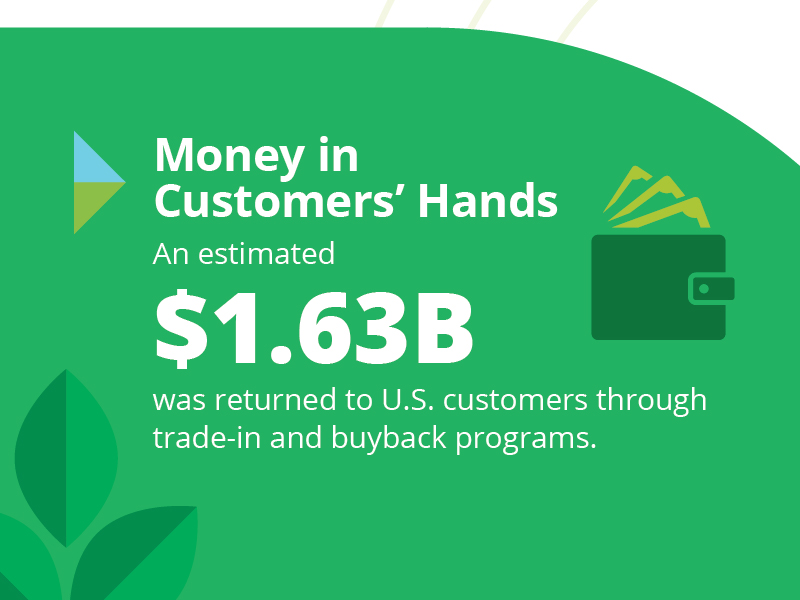
- $1.63 billion returned to consumers, up 31% year over year
- iPhone 13 remained the most turned-in smartphone from trade-in and upgrade programs for the fifth straight quarter
- Samsung Galaxy S23 Ultra became the top turned-in Android device for the first time
- Average device age: 3.81 years, consistent with 2025 levels
These results show that, while they’re holding on to devices longer, consumers continue to engage with trade‑in and upgrade programs when the value is clear.
Trade‑in programs put more money in consumers’ hands
Trade‑in programs returned $1.63 billion to U.S. consumers in Q1 2026, compared with $1.24 billion in Q1 2025 — a 31% year‑over‑year increase. This growth reflects both higher participation and expanded eligibility across carrier programs.
More carriers now accept devices in any condition, making trade‑in accessible to a wider range of consumers. As a result, more devices are entering the secondary market, strengthening supply while continuing to reward consumers financially.
Newer smartphones continue to lead the secondary market
Recent‑generation smartphones remain the backbone of trade‑in and upgrade program activity. The iPhone 13 has now led the rankings for five consecutive quarters, while the past three quarters have featured a mix of iPhone 13 and iPhone 14 models among the turned-in devices.
On the Android side, Q1 marked a shift as the Samsung Galaxy S23 Ultra became the most turned-in Android device for the first time.
Device age remains steady as ownership cycles mature
After reaching record highs in 2025, the average device age at trade‑in remained stable at 3.81 years in Q1 2026, compared to a 3.84‑year average across all of 2025. This stability suggests that consumers are balancing longer ownership with strategic upgrades when trade‑in value peaks.
What Q1 2026 trends mean for the smartphone secondary market
Q1 results reinforce the role of trade‑in and upgrade programs as a stabilizing force across the smartphone lifecycle.
- Consumers unlock more value when it’s time to upgrade.
- Carriers and retailers benefit from consistent upgrade engagement.
- The secondary market gains a steady supply of newer, in‑demand devices.
Together, these dynamics support affordability, sustainability, and long‑term market health.

Assurant Editorial Team
The Assurant Editorial Team shares stories that inspire and empower, helping you unlock opportunities and stay ahead with the latest research and insights. Assurant is a premier global protection company that partners with the world's leading brands. As a Fortune 500 company operating in 21 countries, we leverage data-driven technology solutions to provide exceptional customer experiences.
