4Q 2016 Net Income of $31.3 million, $0.54 per diluted share
Full-Year 2016 Net Income of $565.4 million, $9.13 per diluted share
4Q 2016 Net Operating Income of $27.0 million, $0.46 per diluted share
Full-Year 2016 Net Operating Income of $276.9 million, $4.47 per diluted share
NEW YORK, Feb. 7, 2017 — Assurant, Inc. (NYSE: AIZ), a global provider of risk management solutions, today reported results for fourth quarter and full-year ended Dec. 31, 2016.
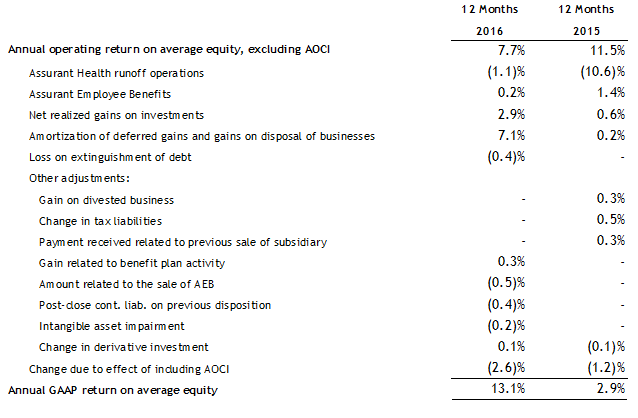
• 13.1 percent GAAP ROE for full-year 2016 • 7.7 percent operating ROE, excluding AOCI, for full-year 20161 • $995 million returned to shareholders in share repurchases and dividends in 2016 • $775 million in corporate capital available at year-end 2016 |
“Progress on our multi-year transformation defined 2016 for us, as we completed the realignment of our portfolio to focus on the Housing and Lifestyle markets, and established our new global operating model,” said Assurant President and Chief Executive Officer Alan Colberg.
“While operating earnings for the year were lower, primarily due to catastrophe losses and the anticipated lender-placed normalization, we continued positioning Assurant for long-term, profitable growth. Importantly, we returned nearly $1 billion to shareholders last year through dividends and share repurchases, which represents substantial progress toward our two-year, $1.5 billion commitment,” Colberg added.
Assurant Revised Reportable Segments
As previously announced, Assurant has revised its reportable segments to align with the company’s evolved global operating model, resulting from its multi-year transformation. As of Dec. 31, 2016, these new reportable segments are Global Housing, Global Lifestyle, Global Preneed and Corporate & Other*. Results from comparable prior periods were revised to conform to the new presentation.
Reconciliation of Net Operating Income to GAAP Net Income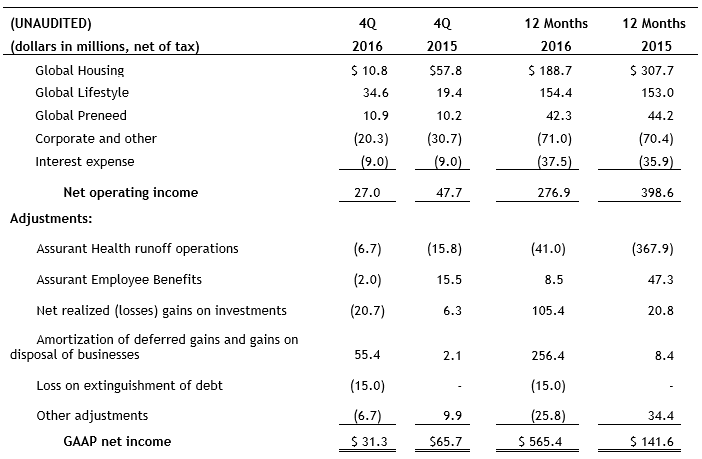
Note: As of fourth quarter 2016, the Company has four reportable segments:* (1) Global Housing (formerly the Assurant Specialty Property reportable segment) provides lender-placed homeowners, manufactured housing and flood insurance, renters insurance and related products (referred to as multi-family housing), and valuation and field services (referred to as mortgage solutions); (2) Global Lifestyle (formerly included in the Assurant Solutions reportable segment) provides mobile device protection, extended service contracts and related services (referred to as Connected Living), vehicle protection products and credit insurance; (3) Global Preneed (formerly included in Assurant Solutions reportable segment) provides pre-funded funeral insurance; and (4) Total Corporate & Other, which includes all other activity of the Company (no change to previous reporting) and Health runoff operations (formerly included in the Assurant Health reportable segment).
* In addition, Assurant Employee Benefits was a separate segment in 2016 and primarily includes activity for the two months prior to its sale.
Additional financial information, including a schedule of disclosed items that affected Assurant’s results by business for the last eight quarters, appears on page 19 of the company’s Financial Supplement and is located in the Investor Relations section of www.assurant.com.
Fourth Quarter 2016 Consolidated Results
- Net income was $31.3 million, or $0.54 per diluted share, compared to fourth quarter 2015 net income of $65.7 million, or $0.97 per diluted share. This decrease was primarily due to $20.7 million net realized losses on investments compared to $6.3 million net realized gains in the fourth quarter 2015, higher reportable catastrophe losses and the ongoing normalization of lender-placed insurance business in Global Housing. These items were partially offset by increased amortization of deferred gains and gains on disposal of businesses resulting from the sale of Assurant Employee Benefits.
- Net operating income2 decreased to $27.0 million, or $0.46 per diluted share, compared to fourth quarter 2015 net operating income of $47.7 million, or $0.71 per diluted share. The decline primarily reflects higher reportable
catastrophe losses and ongoing lender-placed insurance normalization in Global Housing. Improved Connected Living performance in Global Lifestyle and a lower net operating loss in Corporate & Other helped offset some of the decline.
Excluding catastrophe losses, net operating income for fourth quarter 2016 increased to $70.9 million, or $1.22 per diluted share, compared to $57.5 million, or $0.85 per diluted share, in the prior year period. Improved Connected Living performance in Global Lifestyle and a lower net operating loss in Corporate was partially offset by lender-placed normalization.
- Net earned premiums, fees and other income from the Global Housing, Global Lifestyle and Global Preneed segments totaled $1.54 billion, compared to $1.60 billion in fourth quarter 2015, reflecting expected declines in lender-placed insurance and a change in program structure for a large service contract client in Global Lifestyle. Growth in global mobile programs and revenue from vehicle protection offerings offset some of the decline.
Full-Year 2016 Consolidated Results
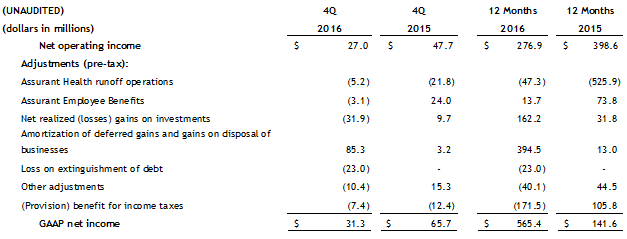
- Net income increased to $565.4 million, or $9.13 per diluted share, compared to full-year 2015 net income of $141.6 million, or $2.05 per diluted share. The majority of the increase was due to lower losses and exit-related charges from Assurant Health runoff operations, and higher amortization of deferred gains and net realized gains on the disposal of businesses primarily from the sale of Assurant Employee Benefits. This was partially offset by higher reportable catastrophe losses and the ongoing normalization of lender-placed insurance business in Global Housing.
- Net operating income2 decreased to $276.9 million, or $4.47 per diluted share, compared to full-year 2015 net operating income of $398.6 million, or $5.78 per diluted share. The decline was primarily due to $83.1 million
of additional reportable catastrophe losses and the ongoing normalization of lender-placed insurance. Expense savings initiatives, including the pension freeze implemented in March, partially offset the decline.
Excluding catastrophe losses, net operating income for full-year 2016 decreased to $379.3 million, or $6.12 per diluted share, compared to $417.9 million, or $6.06 per diluted share in 2015. Ongoing lender-placed normalization was the main cause of the decline.
- Net earned premiums, fees and other income from the Global Housing, Global Lifestyle and Global Preneed segments totaled $6.17 billion, compared to $6.25 billion in 2015, due to expected declines in lender-placed insurance. Growth in vehicle protection and multi-family housing partially offset the decrease. Fee income also increased to $1.4 billion compared to $1.2 billion in 2015 driven by expanded service offerings in mobile and mortgage solutions.
Reportable Segments
Global Housing
- Net operating income decreased in the fourth quarter mainly due to higher reportable catastrophe losses, lender-placed insurance normalization and additional lender-placed regulatory expenses. Reportable catastrophe losses, all related
to Hurricane Matthew, totaled $43.9 million in fourth quarter 2016, compared to $9.8 million of catastrophe losses in fourth quarter 2015. Fourth quarter 2016 included a $19.5 million charge related to the expected settlement of the multistate
lender-placed regulatory examinations, compared to elevated regulatory expenses in fourth quarter 2015.
Full-year 2016 net operating income was down compared to 2015 as the result of $83.1 million in higher reportable catastrophe losses and lender-placed normalization, including a decline in real-estate owned business and the previously disclosed loss of client business. Those decreases were partially offset by savings realized from expense initiatives. - Net earned premiums, fees and other income decreased in fourth quarter 2016, primarily due to lender-placed normalization. Growth in multi-family housing and mortgage solutions, including the acquisition of American Title Inc. (American
Title), partly offset the decline. Excluding American Title, mortgage solutions fee income decreased $7.9 million compared to fourth quarter 2015, mainly from lower volumes in field services.
For full-year 2016, net earned premiums, fees and other income decreased compared to 2015, driven by declines in lender-placed insurance and the impact from the previously disclosed loss of client business. However, revenues benefited from increases in mortgage solutions, including the acquisition of American Title, and the multi-family housing business. Excluding American Title, mortgage solutions fee income increased across valuation and field services.
- Combined ratio for risk-based businesses(a) increased to 105.0 percent from 90.2 percent in fourth quarter 2015, as a result of higher reportable catastrophe losses. Excluding these losses, the combined ratio was 88.8 percent,
up 200 basis points year-over-year primarily due to additional regulatory expenses and new client on-boarding costs. Improved non-catastrophe loss experience was a modest offset.
For full-year 2016, the combined ratio for risk-based businesses increased to 91.1 percent from 83.4 percent in 2015, driven by greater reportable catastrophe losses. Excluding these losses, the combined ratio was 81.7 percent, down 20 basis points year-over-year primarily due to savings from expense initiatives.
- Pre-tax margin for fee-based, capital-light businesses(b) was 11.2 percent, down 50 basis points from the fourth quarter of 2015. The decrease resulted from higher expenses and lower volumes in mortgage solutions, partially
offset by increased earnings at multi-family housing.
For full-year 2016, the pre-tax margin for fee-based, capital-light businesses was 10.8 percent, compared to 11.6 percent in 2015. The decrease was primarily due to increased expenses to support growth at mortgage solutions. Multi-family housing profitability improved largely as a result of revenue growth.
(a) Combined ratio for the Global Housing risk-based businesses is equal to total policyholder benefits, losses and expenses, including reportable catastrophe losses, divided by net earned premiums and fees and other income, for lender-placed and manufactured housing and other businesses.
(b) Pre-tax margin for the Global Housing fee-based, capital-light businesses is equal to income before provision for income taxes divided by total net earned premiums, fees and other income, for multi-family housing and mortgage solutions businesses.
Global Lifestyle
- Net operating income increased in fourth quarter 2016, primarily due to improved mobile and service contract performance in Connected Living and additional investment income from real estate joint venture partnerships. Fourth quarter
2015 included $8.2 million of accounting adjustments that were offset by a decrease in legal reserves.
Full-year 2016 net operating income rose slightly compared to 2015, driven by better mobile performance globally and a $13.3 million net benefit of disclosed items. This was mostly offset by the loss of a tablet client and declines in legacy North American retail clients and credit insurance.
- Net earned premiums, fees and other income decreased compared to fourth quarter 2015 due to a change in program structure for a large service contract client, the impact of foreign exchange, and continued declines in legacy North
American retail clients and credit insurance. The declines were partially offset by fee income growth from global mobile programs and increased premiums from vehicle protection offerings.
For full-year 2016, net earned premiums, fees and other income grew modestly due to an increase in mobile programs, which was largely offset by the impact of foreign exchange, declines in business from North American retail clients and the loss of the tablet program.
- Combined ratio for risk-based businesses(a) increased to 95.6 percent from 94.5 percent in fourth quarter 2015, driven by an increase in vehicle protection losses that were partially offset by an improvement in the credit
insurance loss experience.
For full-year 2016, the combined ratio for risk-based businesses was 95.9 percent versus 95.5 percent in 2015. Results were relatively flat due to consistent performance at both credit insurance and vehicle protection businesses.
- Pre-tax margin for fee-based, capital-light businesses(b) was 3.7 percent, compared to (1.0) percent in fourth quarter 2015. The increase was primarily due to improved mobile earnings from lower expenses and a more profitable
mix of devices. More favorable service contract loss experience also contributed to the margin increase. Fourth quarter 2015 included $12.6 million of pre-tax accounting adjustments.
For full-year 2016 the pre-tax margin for fee-based, capital-light businesses was 3.5 percent, compared to 3.6 percent in 2015. The margin was relatively flat year-over-year as increased mobile profitability was offset by the loss of a tablet program and lower contributions from the service contract business, including declines from legacy North American retail clients.
(a) Combined ratio for the Global Lifestyle risk-based businesses is equal to total policyholder benefits, losses and expenses, divided by net earned premiums and fees and other income, for global vehicle protection, credit and other businesses.
(b) Pre-tax margin for the Global Lifestyle fee-based, capital-light businesses is equal to income before provision for income taxes divided by total net earned premiums, fees and other income, for Connected Living, including mobile and extended service contracts.
Global Preneed
- Net operating income increased in fourth quarter 2016 relative to fourth quarter 2015, primarily due to additional investment income from real estate joint venture partnerships. Full-year 2016 net operating income was slightly lower than in 2015. Excluding the $3.9 million accounting adjustment in first quarter 2016, net operating income increased for the year, also mainly due to investment income from real estate joint venture partnerships. Underlying business performance remained constant.
- Net earned premiums, fees and other income increased in the fourth quarter and for full-year 2016, primarily as the result of sales of policies written in prior years.
- Face sales of $231.3 million in the fourth quarter 2016 were flat compared to fourth quarter 2015. For full-year 2016, sales increased modestly to $942.6 million compared to $939.0 million for full-year 2015. Face sales benefited from our alignment with market leaders.
Corporate & Other![]()
- Net operating loss3 decreased in fourth quarter 2016, primarily due to lower tax expense and higher net investment income resulting from increased assets at the holding company following the sale of Assurant Employee Benefits. This benefit was partially offset by an increase in expenses to support the multi-year transformation. For the full year, net operating loss was relatively flat compared to 2015. Increased net investment income was primarily offset by overhang expenses associated with the sale of Assurant Employee Benefits and additional expenses to support the company’s multi-year transformation.
Capital Position
- Corporate capital approximated $775 million as of Dec. 31, 2016. Deployable capital totaled approximately $525 million, net of the company’s $250 million risk buffer.
Dividends from the businesses paid to the holding company in fourth quarter totaled $341 million. This included $120 million from Assurant Health, $125 million in capital releases from the sale of Assurant Employee Benefits, and $96 million from Global Housing, Global Lifestyle and Global Preneed.
During the quarter, the company completed a tender offer for a portion of its senior notes maturing in 2034, which reduced corporate capital by $125 million. In addition, the company set aside $130 million of capital in advance of the February closing of the Green Tree Insurance Agency Inc. acquisition and an investment in mobile capabilities.
For full-year 2016, the businesses paid approximately $1.7 billion of dividends, net of infusions, to the holding company. This total includes $458 million from Assurant Health, $893 million in proceeds and capital releases from the sale of Assurant Employee Benefits, and $315 million from Global Housing, Global Lifestyle and Global Preneed segments.
- Share repurchases and dividends totaled $212 million in fourth quarter 2016. Dividends to shareholders totaled $30 million, and Assurant repurchased approximately 2.1 million shares of common stock for $182 million. From Jan. 1 through
Feb. 3, 2017, the company repurchased an additional 378,000 shares for approximately $36.1 million, with $646.8 million remaining under the current repurchase authorization.
For full-year 2016, share repurchases and dividends totaled $995 million. Assurant repurchased approximately 10.5 million shares of common stock overall for $869 million and paid dividends to shareholders totaling $125 million.
Company Outlook
Based on current market conditions, for full-year 2017 the company expects:
- Assurant net operating income, excluding reportable catastrophe losses, to be roughly level with 2016 results, excluding catastrophe losses, as profitable growth primarily in fee-based, capital-light offerings including Connected Living, multi-family housing and mortgage solutions, as well as vehicle protection is offset by declines in lender-placed insurance and other legacy businesses. Expense savings from enterprise transformation projects are expected to be reinvested in the business.
- Assurant operating earnings per diluted share, excluding catastrophe losses, to grow double-digits from 2016 primarily due to share repurchase activity last year.
- Global Housing net earned premiums and net operating income, excluding reportable catastrophe losses, to decrease from 2016 due to the ongoing lender-placed insurance normalization. Results to be partially offset by expense savings and profitable growth in multi-family housing and mortgage solutions. Multi-family housing and mortgage solutions to expand market share.
- Global Lifestyle to increase net operating income as a result of improved performance in Connected Living driven primarily by mobile, as well as higher contributions from vehicle protection and expense efficiencies. Declines in credit insurance and legacy North American retail clients to continue. Revenue expected to decrease, largely due to a change in program structure for a large service contract client. Under the new structure, the overall economics of the program are maintained with no impact to profitability, however net earned premiums will be lower by approximately $500 million compared to 2016 with a commensurate reduction in expenses. Excluding this, net earned premiums and fee income to increase from growth in Connected Living and vehicle protection globally. Results to be impacted by foreign exchange.
- Global Preneed fee income and earnings to increase due to sales growth across North America from our alignment with market leaders and operational efficiencies.
- Corporate & Other4 full-year net operating loss to be level with 2016 at approximately $70 million as continued expense initiatives are offset by investments to support our multi-year transformation.
- Capital to be deployed through a combination of share repurchases, common stock dividends, and reinvestments and acquisitions in the business, subject to market conditions and other factors. Business segment dividends from Global Housing, Global Lifestyle and Global Preneed to approximate segment net operating income, subject to the growth of the businesses, rating agency and regulatory capital requirements. Approximately $100 million in additional dividends expected from Assurant Health and Assurant Employee Benefits, subject to regulatory approval.
Earnings Conference Call
The fourth quarter 2016 earnings conference call and webcast will be held Wednesday, Feb. 8, 2017 at 8:00 a.m. ET. The live and archived webcast, along with supplemental information, will be available in
the Investor Relations section of www.assurant.com.
About Assurant
Assurant, Inc. (NYSE: AIZ) is a global provider of risk management solutions, protecting where consumers live and the goods they buy. A Fortune 500 company, Assurant focuses on the housing and lifestyle markets, and
is among the market leaders in mobile device protection and related services; extended service contracts; vehicle protection; pre-funded funeral insurance; renters insurance; lender-placed homeowners insurance; and mortgage valuation and field services.
With approximately $30 billion in assets as of December 31, 2016 and $6 billion in 2016 revenue, Assurant operates in 16 countries, while its Assurant Foundation works to support and improve communities. Learn more at assurant.com or on Twitter @AssurantNews.
Media Contact:
Linda Recupero
Senior Vice President, Global Communication
Phone: 212.859.7005
[email protected]
Investor Relations Contact:
Suzanne Shepherd
Vice President, Investor Relations
Phone: 212.859.7062
[email protected]
Safe Harbor Statement
Some of the statements included in this news release and its exhibits, particularly those anticipating future financial performance, business prospects, growth and operating strategies and similar matters,
are forward-looking statements within the meaning of the U.S. Private Securities Litigation Reform Act of 1995. You can identify these statements by the use of words such as “outlook,” “will,” “may,” “anticipates,”
“expects,” “estimates,” “projects,” “intends,” “plans,” “believes,” “targets,” “forecasts,” “potential,” “approximately,” or the
negative version of those words and other words and terms with a similar meaning. Any forward-looking statements contained in this news release or its exhibits are based upon our historical performance and on current plans, estimates and expectations.
The inclusion of this forward-looking information should not be regarded as a representation by us or any other person that the future plans, estimates or expectations contemplated by us will be achieved. Our actual results might differ materially
from those projected in the forward-looking statements. The company undertakes no obligation to update or review any forward-looking statements in this news release or the exhibits, whether as a result of new information, future events or other developments.
The following risk factors could cause our actual results to differ materially from those currently estimated by management, including those projected in the company outlook:
| (i) | loss of significant client relationships or business, distribution sources or contracts and reliance on a few clients; |
| (ii) | general global economic, financial market and political conditions and conditions in the markets in which we operate; |
| (iii) | failure to adequately predict or manage claims and other costs; |
| (iv) | inadequacy of reserves established for future claims; |
| (v) | losses due to natural or man-made catastrophes; |
| (vi) | a decline in our credit or financial strength ratings (including the risk of ratings downgrades in the insurance industry); |
| (vii) | risks related to our international operations, including fluctuations in exchange rates; |
| (viii) | deterioration in our market capitalization compared to its book value that could result in an impairment of goodwill; |
| (ix) | failure to maintain effective internal control over financial reporting; |
| (x) | failure to effectively maintain and modernize our information technology systems; |
| (xi) | data breaches compromising client information and privacy; |
| (xii) | cyber security threats and cyber-attacks; |
| (xiii) | significant competitive pressures in our businesses; |
| (xiv) | inability to execute strategic plans related to acquisitions, dispositions or new ventures or integrate them effectively; |
| (xv) | failure to attract and retain sales representatives, key managers or agents; |
| (xvi) | diminished value of invested assets in our investment portfolio (due to, among other things, volatility in financial markets; the global economic slowdown; credit, currency and liquidity risk; other than temporary impairments and increases in interest rates); |
| (xvii) | unfavorable outcomes in litigation and/or regulatory investigations that could negatively affect our results, business and reputation; |
| (xviii) | current or new laws and regulations that could increase our costs and decrease our revenues; |
| (xix) | uncertain tax positions and unexpected tax liabilities; |
| (xx) | risks related to outsourcing activities; |
| (xxi) | decline in the value of mobile devise in our inventory or subject to guaranteed buyback; |
| (xxii) | Employee misconduct; |
| (xxiii) | unavailability, inadequacy and unaffordable pricing of reinsurance coverage; |
| (xxiv) | insolvency of third parties to whom we have sold or may sell businesses through reinsurance or modified co-insurance; |
| (xxv) | inability of reinsurers to meet their obligations; |
| (xxvi) | credit risk of some of our agents; |
| (xxvii) | inability of our subsidiaries to pay sufficient dividends; and |
| (xxviii) | failure to successfully execute our transformation, retain and hire qualified personnel including key executives and provide for succession of key executives. |
For a detailed discussion of the risk factors that could affect our actual results, please refer to the risk factors identified in our SEC reports, including, but not limited to our Annual Report on Form 10-K and Quarterly Reports on Form 10-Q, as filed with the SEC.
Non-GAAP Financial Measures
Assurant uses the following non-GAAP financial measures to analyze the company’s operating performance for the periods presented in this news release. Because Assurant’s calculation of these measures may differ from similar measures used by other companies, investors should be careful when comparing Assurant’s non-GAAP financial measures to those of other companies.
(1) Assurant uses operating return on equity ("Operating ROE"), excluding accumulated other comprehensive income ("AOCI"), as an important measure of the company’s operating performance. Operating ROE, excluding AOCI, equals net operating income (defined below) for the periods presented divided by average stockholders’ equity, excluding AOCI, for the year to date period. The company believes operating ROE provides a valuable measure of the performance of the company’s ongoing business, because it excludes the effect of Assurant Health runoff operations and the divested Assurant Employee Benefits business, which was sold on March 1, 2016. The calculation also excludes net realized gains (losses) on investments, amortization of deferred gains and gains on disposal of businesses and those events that are highly variable and do not represent the ongoing operations of the company. The comparable GAAP measure is GAAP return on equity (“GAAP ROE”), defined as net income, for the periods presented, divided by average stockholders’ equity for the year to date period.
(2) Assurant uses net operating income as an important measure of the company’s operating performance. Net operating income equals net income -- excluding Assurant Health runoff operations, Assurant Employee Benefits, net realized gains (losses) on investments, amortization of deferred gains and gains on disposal of businesses and other highly variable items. The company believes net operating income provides a valuable measure of the performance of the company’s ongoing business because it excludes the effect of Assurant Health runoff operations and the divested Assurant Employee Benefits business, which the company sold on March 1, 2016. The calculation also excludes net realized gains (losses) on investments, amortization of deferred gains and gains on disposal of businesses and those events that are highly variable and do not represent the ongoing operations of the company.
(3) Assurant uses Corporate & Other net operating loss as an important measure of the corporate segment’s operating performance. Corporate & Other net operating loss equals segment net income (loss), excluding amortization of deferred gains and gains on disposal of businesses, net realized gains (losses) on investments, interest expense and other highly variable items. The company believes Corporate & Other net operating loss provides a valuable measure of the performance of the company’s corporate segment because it excludes the effect of amortization of deferred gains and gains on disposal of businesses, net realized gains (losses) on investments, interest expense and those events that are highly variable and do not represent the ongoing operations of the company’s Corporate & Other segment. The comparable GAAP measure is Total Corporate & Other segment net income.
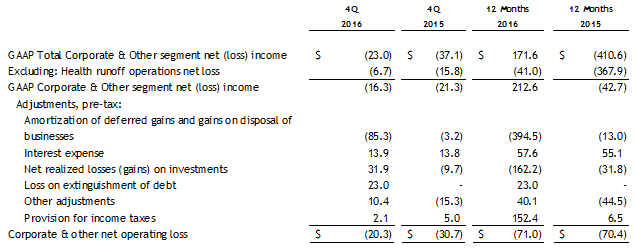
(4) The company outlook for Corporate & Other full-year net operating loss constitutes forward-looking information and the company believes that it cannot reconcile such forward-looking information to the most comparable GAAP measure without unreasonable efforts. A reconciliation would require the company to quantify amortization of deferred gains and gains on disposal of businesses, interest expense, net realized gains on investments, and change in derivative investment. The last two components cannot be reliably quantified due to the combination of variability and volatility of such components and may, depending on the size of the components, have a significant impact on the reconciliation. The company is able to reasonably quantify the first two components for the forecast period, assuming the company does not incur additional debt in the forecast period. Amortization of deferred gains and gains on disposal of businesses is approximately $64.5 million after-tax while interest expense is approximately $32.1 million after-tax.
A summary of net operating income disclosed items is included on page 19 of the company’s Financial Supplement, which is available in the Investor Relations section of www.assurant.com.
Assurant, Inc.
Consolidated Statement of Operations (unaudited)
Three Months and Twelve Months Ended December 31, 2016 and 2015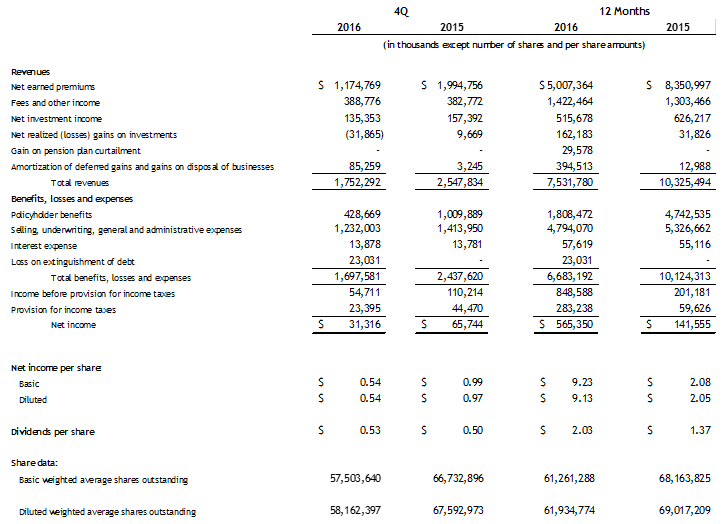
Assurant, Inc.
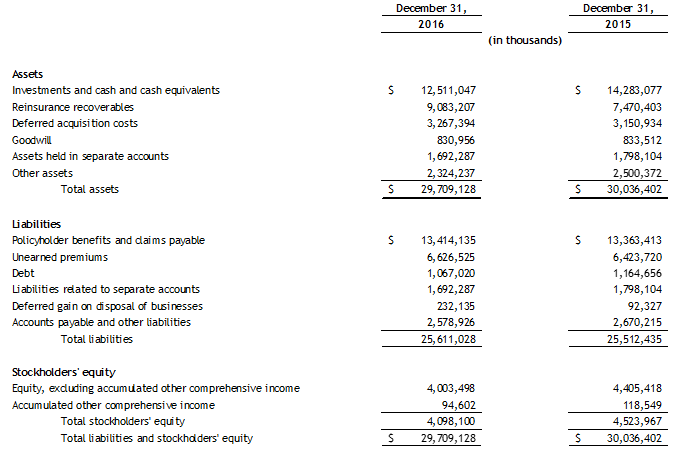
Consolidated Condensed Balance Sheets (unaudited)
At December 31, 2016 and Dec. 31, 2015